pHoenix Project Update: First Lab Results and Upcoming Events
It’s been two years since this project began, and I’m excited to share a major update on our progress developing a portable, affordable spectrophotometric pH sensor for seawater.
Hardware Development
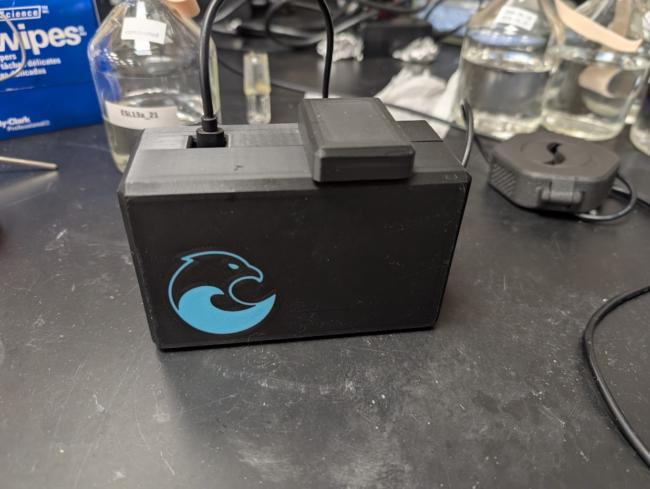
The pHoenix instrument has gone through numerous hardware revisions over the past two years. The design has evolved significantly, and I now have a working prototype ready for rigorous lab testing and calibration.
See It In Person: Ocean Sciences Meeting 2026
I’ll be at the Ocean Sciences Meeting 2026 in Glasgow with a trade booth where you can see the pHoenix in action. Stop by for a hands-on demonstration of the instrument and to discuss how this technology might support your research or citizen science efforts.
I will also be running a one hour workshop on open source ocean hardware development so be sure to stop by if you are interested in participating in that!
Lab Testing Update: First Comparison Against a Research-Grade Spectrometer
This is the exciting part. We’ve completed our first head-to-head comparison of the pHoenix against an Agilent 8453 UV-Vis spectrometer, the kind of lab instrument that costs tens of thousands of dollars.
Background
Spectrophotometric pH works by adding a pH-sensitive indicator dye, meta-Cresol Purple (mCP), to a seawater sample. The dye exists in two forms, acidic and basic, that absorb light at different wavelengths, 434 nm (blue) and 578 nm (green). The ratio of absorbances at these two wavelengths (R = A578 / A434) maps directly to pH through a published equation that also takes temperature and salinity as inputs.
A lab spectrometer like our Agilent 8453 uses a monochromator to isolate narrow (~1 nm) bands at exactly 434 and 578 nm. The pHoenix uses LEDs instead, which are broader (~20-30 nm FWHM) and may not be centered exactly on the target wavelengths. This makes the instrument small and cheap enough for field use, but means the effective extinction coefficients could differ from published values. This test is a first look at how much that matters.
Both instruments use the same two-point indicator perturbation correction: measure at 20 uL of indicator, add another 20 uL, measure again, then extrapolate back to what the pH would be with zero indicator added. This corrects for the slight pH shift the indicator itself introduces.
Procedure
Five seawater samples covering a range of pH values: three synthetic DIC standards (1600, 2000, 2400 umol/kg) and two natural filtered seawater samples (ESL12, ESL13). All measurements at room temperature (~23 C). Samples for the spectrometer were filled into 10 cm pathlength cuvettes via syringe with tubing and left capped in an aluminum block to equilibrate.
Agilent 8453 procedure: Place cell into spectrometer, take background, add 20 uL purified mCP (4 mM), mix, measure, add 20 uL more, mix, measure again. Two replicates per sample.
pHoenix procedure: Rinse standard 1cm cuvette with sample, fill to line, take baseline reading, add 20 uL mCP, mix with transfer pipette (to avoid introducing bubbles), measure, add 20 uL more, mix, measure again. Multiple replicates per sample (3-7 depending on analyte).
Multi-read stability test: A separate test where a single sample was kept in the pHoenix cuvette and remeasured 111 times over approximately 11 minutes to assess instrument stability and drift.
Results
pH Comparison: pHoenix vs. Agilent 8453
The table below summarizes pH values corrected to 0 uL indicator (two-point perturbation correction) for both instruments.
| Analyte | Agilent Mean | Agilent Std | Agilent N | pHoenix Mean | pHoenix Std | pHoenix N | Difference (P-A) |
|---|---|---|---|---|---|---|---|
| 1600 | 7.7607 | 0.0027 | 2 | 7.7137 | 0.0308 | 3 | -0.0470 |
| 2000 | 7.9093 | 0.0016 | 2 | 7.8312 | 0.0087 | 3 | -0.0781 |
| 2400 | 7.9050 | 0.0004 | 2 | 7.8309 | 0.0046 | 7 | -0.0742 |
| ESL12 | 7.7505 | 0.0001 | 2 | 7.7021 | 0.0143 | 3 | -0.0484 |
| ESL13 | 7.8610 | 0.0011 | 2 | 7.7794 | 0.0034 | 3 | -0.0816 |
| OVERALL (pooled) | 7.8373 | 0.0015 | 10 | 7.7839 | 0.0136 | 19 | -0.0534 |
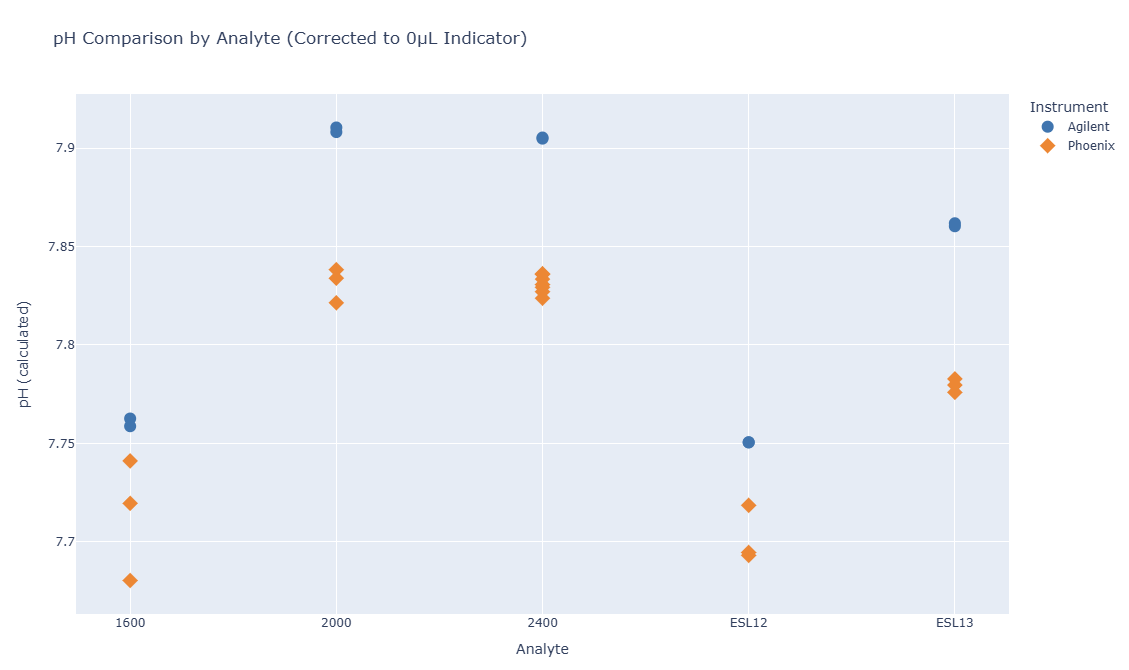
Figure 1. pHoenix vs. Agilent 8453 pH measurements (corrected to 0 uL indicator) for five seawater samples.
The pHoenix reads systematically lower than the Agilent across all samples, and the offset varies with pH. Plotting the pH delta against the Agilent reference pH shows a trend:
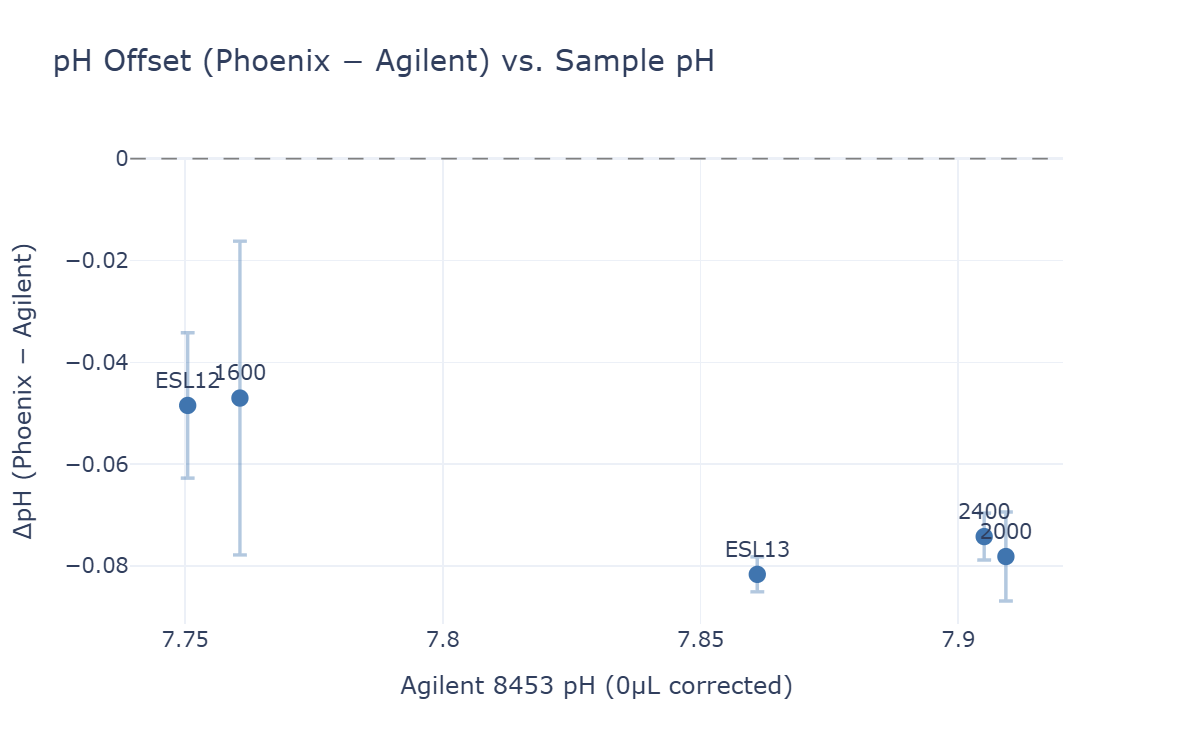
Figure 2. pH offset (pHoenix minus Agilent) as a function of reference pH. Each point is one analyte, with error bars showing pHoenix replicate standard deviation. The dashed line at zero highlights the systematic negative offset. It seems like the offset grows with increasing pH.
The offset ranges from about -0.047 at pH 7.76 to -0.082 at pH 7.86. This pH-dependent pattern is consistent with mismatched effective extinction coefficients from the LED bandwidth differences. But I need to run some more rigorous calibration tests to make sure this isn’t just experimental error or some other effect.
Indicator Perturbation Correction: Effect on Variance
The indicator perturbation correction (extrapolating from 20 uL and 40 uL readings to 0 uL) adds measurement noise. The table below compares standard deviations before and after the correction.
Per-analyte standard deviations:
| Analyte | pHoenix 20 uL | pHoenix 0 uL | Agilent 20 uL | Agilent 0 uL |
|---|---|---|---|---|
| 1600 | 0.0172 | 0.0308 | 0.0017 | 0.0027 |
| 2000 | 0.0045 | 0.0087 | 0.0022 | 0.0016 |
| 2400 | 0.0028 | 0.0046 | 0.0009 | 0.0004 |
| ESL12 | 0.0075 | 0.0143 | 0.0006 | 0.0001 |
| ESL13 | 0.0030 | 0.0034 | 0.0003 | 0.0011 |
Pooled standard deviations (overall precision estimate):
| Instrument | 20 uL Std | 0 uL Std (corrected) | Ratio (0 uL / 20 uL) |
|---|---|---|---|
| pHoenix | 0.0076 | 0.0136 | 1.79x |
| Agilent | 0.0013 | 0.0015 | 1.14x |
The correction formula (pH0 = 2 * pH20 - pH40) amplifies uncorrelated measurement noise by up to sqrt(5) = 2.24x. The pHoenix shows a 1.79x increase, indicating that its noise is predominantly uncorrelated random measurement error. The Agilent shows only a 1.14x increase, meaning its variance is dominated by correlated sample-to-sample factors (temperature, sample prep) that cancel out in the correction. Unsurprisingly, the Agilent is precise enough that the correction barely costs anything. But the pHoenix’s noise floor is still high enough that this standard perturbation correction has a noticeable penalty. Hopefully I can bring this noise down more in the future.
Multi-Read Stability Test
Keeping the same sample in the pHoenix cuvette and remeasuring 111 times over 10.7 minutes:
| Metric | Value |
|---|---|
| Number of readings | 111 |
| Duration | 10.7 min |
| Temperature range | 24.16 - 24.33 C (delta = 0.17 C) |
| Raw pH std dev | 0.0006 |
| pH vs. temperature slope | +0.011 pH/C |
| R-squared (pH vs. temperature) | 0.854 |
| Residual std dev (temperature-corrected) | 0.0002 |
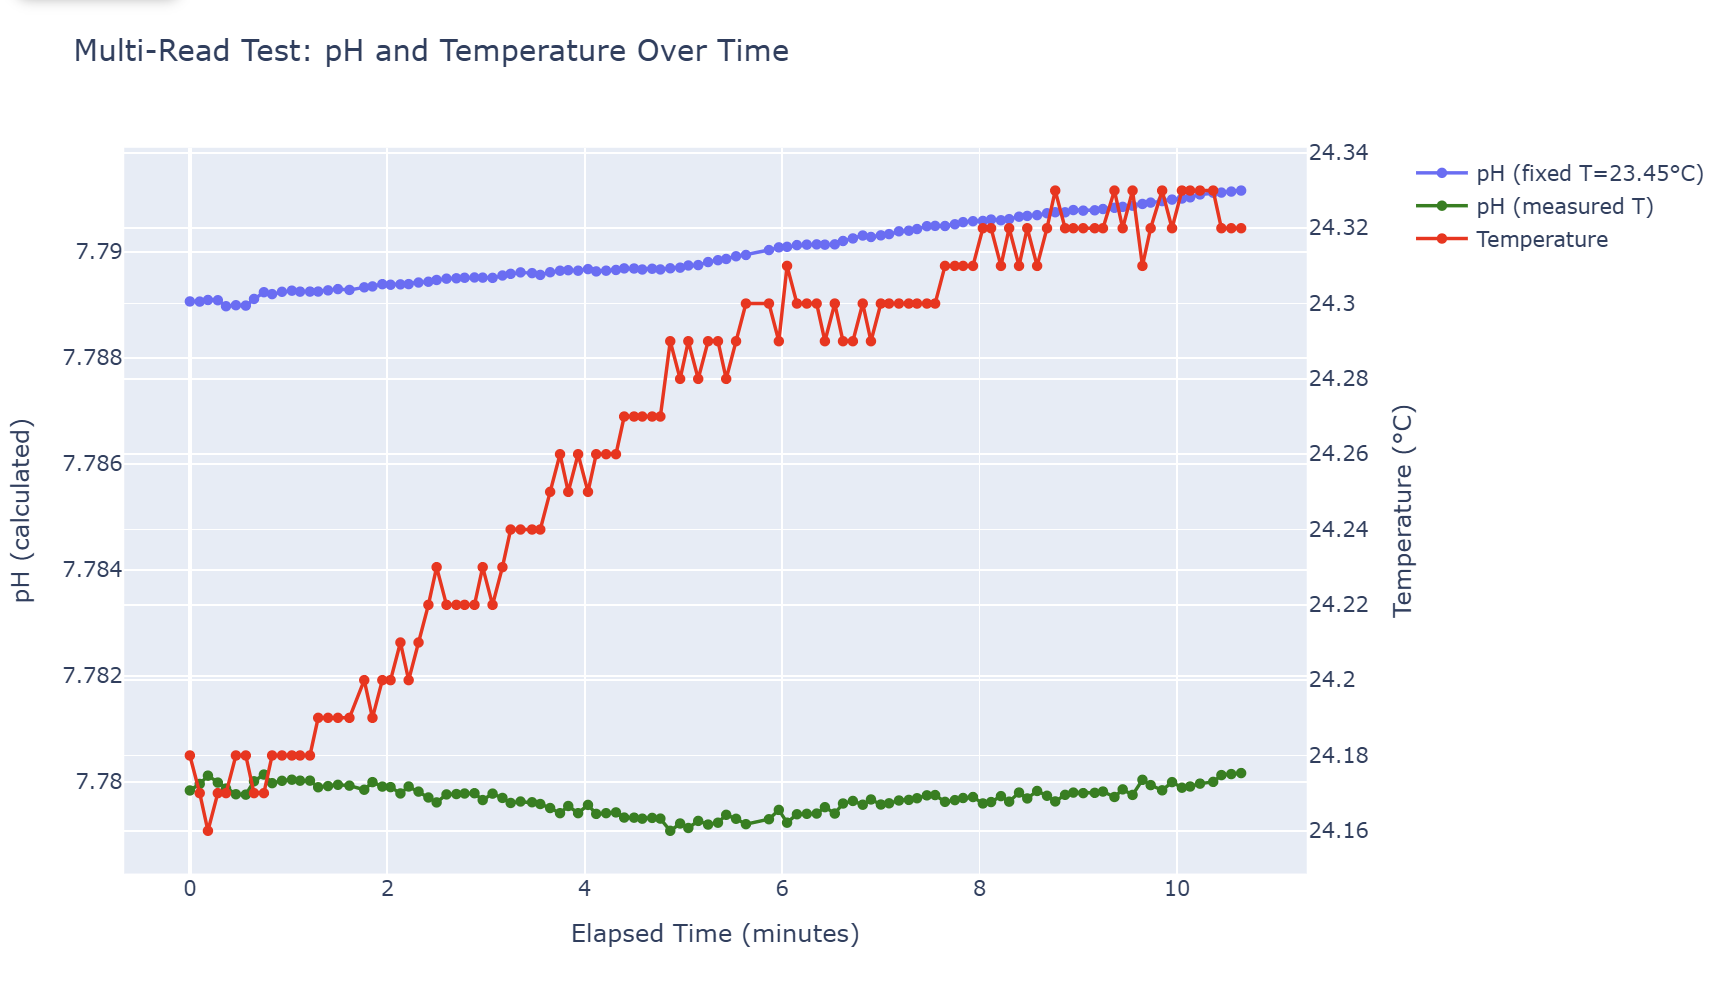
Figure 4. Blue pH line is based on a single in-situ temperature reading taken during the trial. Red temperature line is an internal system temperature taken near the cuvette, but is not an in-situ temperature. Green pH is calculated from the internal system temperature. Blue pH tracks closely with the 0.17 C temperature drift near the cuvette (R-squared = 0.85). Residual standard deviation after removing the temperature trend (green line) is 0.0002 pH.
Temperature unfortunately was not tracked in-situ (will be feature in next revision). But it is taken by a floating thermistor which sits near the cuvette. So the hope is that the temperature trend measured there somewhat matches what is being experienced inside the cuvette. If we use this assumption, temperature seems to be able to explain 85% of the apparent variance. The measured slope of ~0.011 pH/C is consistent with the expected pH change dependence of the indicator dye/seawater mixture. After removing the temperature trend, the residual standard deviation drops to 0.0002 pH. This is likely closer to the true instrument precision, and the “drift” is really just the pHoenix faithfully tracking real pH changes as the sample warms up in the cuvette. With accurate in-situ temperature measurements, it might explain even more than 85% of the variance.
Other Misc Tests
I performed some other simple tests but this is now only qualitative results. I did not put together any formal experiments
Ambient light Exclusion: I tried taking some sample measurements with and without the light cap on the cuvette. And even with ambient light shining down the cuvette, and with my phone flashlight shining into the cuvette, I did not notice any significant change in the measurement to the third decimal place. It is possible there might be a small offset hidden in the noise, but it seems to be quite resistant to ambient light effects.
Conclusions
Precision is very good. The pHoenix achieves 0.0002 pH instrument precision after temperature correction, which is comparable to what you can expect from a well-maintained lab spectrometer. Even the uncorrected sample-to-sample pooled standard deviation of 0.0076 pH (at 20 uL) is reasonable given the complete lack of temperature control during these measurements.
Accuracy needs work. There is a systematic offset of -0.05 to -0.08 pH from the Agilent 8453, and it varies with pH. The pH-dependent pattern points directly to the LED bandwidth issue. Since the pHoenix measures a weighted average of absorbance across a broad LED emission band rather than at a single wavelength, the effective extinction coefficients differ from the published values used in the standard pH equation.
In-situ Temperature is going to need to be a core feature. The multi-read test seems to make it very clear that the precision of the instrument is so high, that even .1C changes in temperature very noticeably affect the measurement. An in-situ temperature measurement is going to likely be a required feature. And even calibration of that in-situ sensor may be necessary. Will need to do some more tests to see.
What’s Next
My immediate priorities are:
- LED characterization: Measure the exact emission spectra of our LEDs using a spectrometer to hopefully derive pHoenix-specific extinction coefficients
- In-situ temperature: Will need to include a thermistor inside the cuvette. This means I will likely need to have a fixed cuvette of some sort for now until I can think of a better way to measure temperature internally.
- Additional pH testing: In particular across a wider pH range (like 7 - 8.5) and with buffered solutions. Need to develop the calibrations across the range for accurate results.